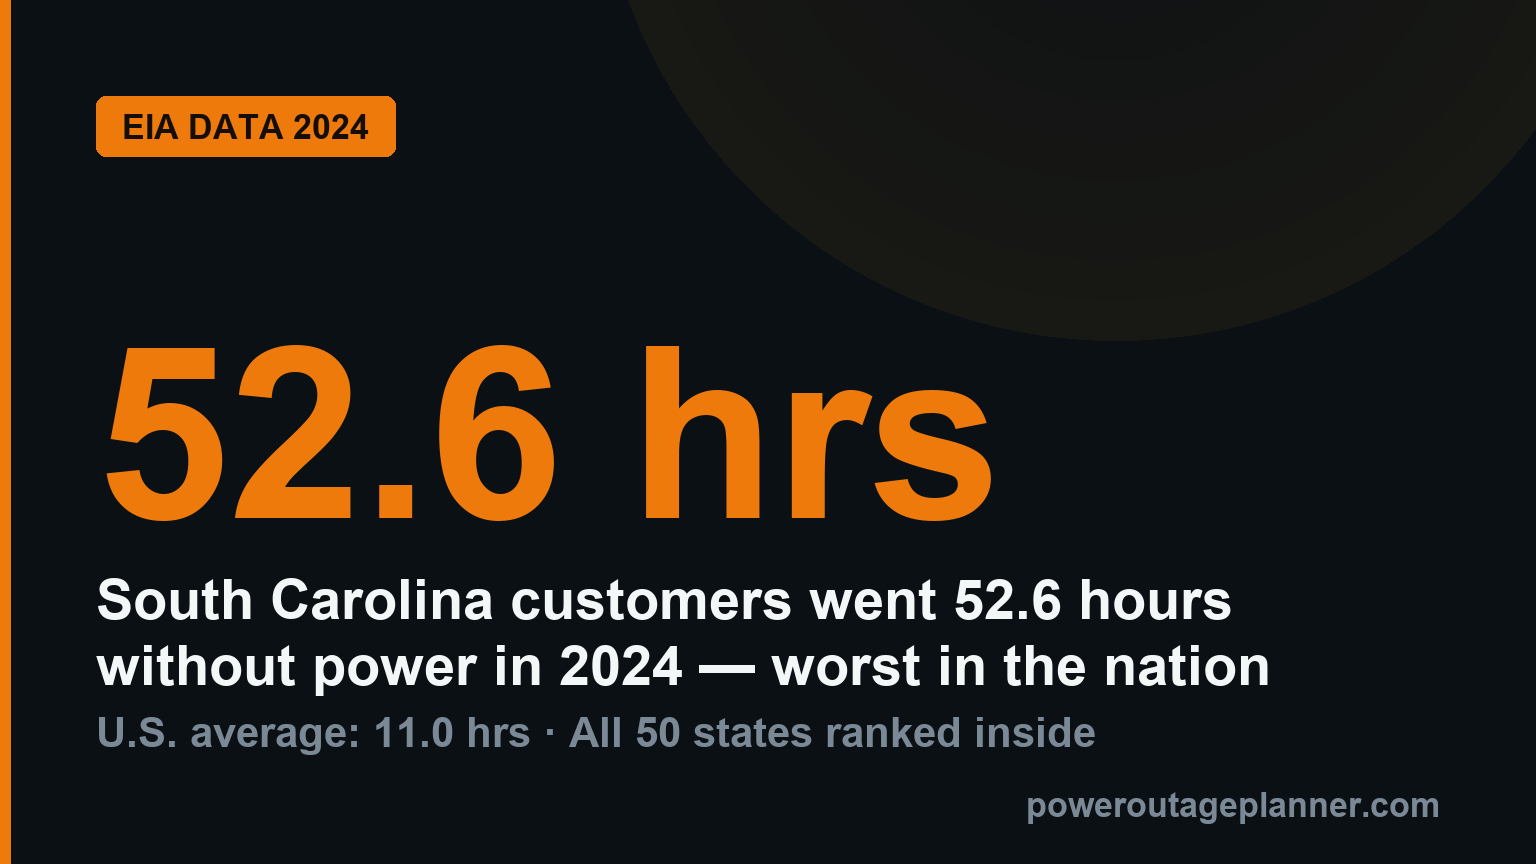
The average U.S. electricity customer spent 11.0 hours without power in 2024, the most in at least a decade, and customers in the worst state, South Carolina (52.6 hours), waited nearly 38 times longer than customers in the best-performing states, Arizona and South Dakota (1.4 hours each) (EIA, Electric Power Annual, Table 11.4).
This analysis converts the EIA’s newest state-level reliability data, published in minutes, into hours without power per customer for all 50 states and the District of Columbia. Data year 2024 is the latest full year available (Electric Power Annual 2024, released late 2025; confirmed current as of July 2026). Each state gets two numbers: total hours including major weather events, and hours from routine outages only. The gap between those two numbers tells you whether a state’s problem is hurricanes or everyday grid failure.
Key findings
- The average U.S. electricity customer went 11.0 hours without power in 2024, the most in at least a decade and nearly double the average of the preceding ten years (EIA, Today in Energy).
- South Carolina had the longest outages of any state: 52.6 hours per customer, 4.8× the national average, driven mainly by Hurricane Helene (EIA).
- Hurricanes Beryl, Helene, and Milton drove 80% of all U.S. outage hours in 2024, roughly 9 of the average customer’s 11 hours (EIA).
- Excluding major events, the average customer lost just 2.2 hours in 2024, consistent with every year since 2013. Routine grid reliability is not getting worse (EIA, Today in Energy).
- West Virginia has the nation’s worst everyday reliability: 8.1 hours of outages even with major events excluded, almost 4× the national baseline of 2.2 hours (EIA).
- Arizona and South Dakota were the most reliable states at 1.4 hours each; District of Columbia customers averaged just 0.5 hours all year (EIA).
- 80% of all major U.S. power outages from 2000 to 2023 (1,755 events) were weather-related, and Texas leads all states with 210 of them (Climate Central).
Average power outage duration by state (2024)
The table below ranks all 50 states plus DC from worst to best by total hours without power per customer in 2024, using EIA’s IEEE-standard SAIDI values converted from minutes to hours. “With major events” counts everything, including hurricanes and ice storms. “Without major events” is routine reliability only. The final column compares each state’s total against the U.S. average of 11.0 hours. The five worst and best performers are in bold (six at the reliable end, because Massachusetts, North Dakota, and Rhode Island tie at 1.7 hours).
| State | Hours with major events | Hours without major events | vs U.S. average (11.0 h) |
|---|---|---|---|
| South Carolina | 52.6 | 1.9 | 4.8× worse |
| Maine | 29.1 | 4.6 | 2.6× worse |
| Texas | 26.9 | 2.6 | 2.4× worse |
| North Carolina | 25.3 | 2.4 | 2.3× worse |
| Florida | 24.8 | 1.1 | 2.3× worse |
| Georgia | 20.1 | 3.5 | 1.8× worse |
| West Virginia | 19.4 | 8.1 | 1.8× worse |
| Virginia | 16.0 | 4.1 | 1.5× worse |
| Vermont | 14.9 | 3.9 | 1.4× worse |
| New Hampshire | 12.3 | 1.4 | 1.1× worse |
| Nebraska | 11.6 | 1.2 | 1.1× worse |
| Washington | 10.7 | 2.6 | about average |
| Louisiana | 10.5 | 3.6 | about average |
| Mississippi | 10.1 | 4.7 | 1.1× better |
| Oregon | 9.7 | 2.1 | 1.1× better |
| Kentucky | 9.0 | 2.4 | 1.2× better |
| Arkansas | 8.8 | 3.4 | 1.3× better |
| Ohio | 8.5 | 2.2 | 1.3× better |
| Michigan | 8.0 | 2.7 | 1.4× better |
| New York | 8.0 | 2.4 | 1.4× better |
| Hawaii | 6.4 | 3.7 | 1.7× better |
| Pennsylvania | 5.9 | 2.2 | 1.9× better |
| Montana | 5.7 | 2.5 | 1.9× better |
| Alaska | 5.4 | 3.2 | 2.0× better |
| Indiana | 5.2 | 2.1 | 2.1× better |
| Wisconsin | 4.9 | 1.6 | 2.2× better |
| California | 4.8 | 2.7 | 2.3× better |
| Kansas | 4.8 | 1.7 | 2.3× better |
| Tennessee | 4.8 | 2.8 | 2.3× better |
| New Mexico | 4.5 | 2.5 | 2.4× better |
| Colorado | 4.3 | 2.0 | 2.6× better |
| Minnesota | 3.7 | 1.5 | 3.0× better |
| Oklahoma | 3.7 | 2.0 | 3.0× better |
| Missouri | 3.5 | 1.8 | 3.1× better |
| Idaho | 3.4 | 2.5 | 3.2× better |
| Alabama | 3.3 | 2.0 | 3.3× better |
| Iowa | 3.3 | 1.4 | 3.3× better |
| New Jersey | 2.9 | 1.6 | 3.8× better |
| Illinois | 2.6 | 1.0 | 4.2× better |
| Nevada | 2.6 | 1.1 | 4.2× better |
| Connecticut | 2.5 | 1.2 | 4.4× better |
| Wyoming | 2.3 | 1.9 | 4.8× better |
| Delaware | 2.0 | 1.1 | 5.5× better |
| Maryland | 2.0 | 1.3 | 5.5× better |
| Utah | 1.9 | 1.8 | 5.8× better |
| Massachusetts | 1.7 | 1.3 | 6.5× better |
| North Dakota | 1.7 | 1.4 | 6.5× better |
| Rhode Island | 1.7 | 1.0 | 6.5× better |
| Arizona | 1.4 | 1.2 | 7.9× better |
| South Dakota | 1.4 | 1.0 | 7.9× better |
| District of Columbia | 0.5 | 0.4 | 22× better |
The 10 states that lose power the most
The 2024 worst-10 list, by average hours without power per customer: South Carolina (52.6), Maine (29.1), Texas (26.9), North Carolina (25.3), Florida (24.8), Georgia (20.1), West Virginia (19.4), Virginia (16.0), Vermont (14.9), and New Hampshire (12.3). One caveat on wording: this ranks outage duration. If you rank outage frequency, Hawaii tops the list with 4.4 interruptions per customer in 2024 against a national average of 1.5 (EIA).
Two distinct failure patterns hide inside this list. The first is hurricane damage. South Carolina’s routine-outage figure was just 1.9 hours, better than the national baseline; Hurricane Helene alone is why its total hit 52.6 (EIA). Helene caused more than 4.7 million customer outages across 10 Southeast states at its September 2024 peak, which also explains North Carolina and Georgia (S&P Global). Texas got Hurricane Beryl, which knocked out more than 2.2 million Houston-area customers in July; roughly 98,000 Texans were still dark a full week after landfall (Texas Tribune). Florida got Hurricane Milton, which cut power to about 3.4 million customers in October (Utility Dive). Florida’s without-events figure of 1.1 hours is among the best in the country. Its grid is fine on a normal day; its geography is not.
The second pattern is chronic. West Virginia customers lost 8.1 hours even with every major event stripped out, the worst routine reliability in the nation and nearly quadruple the 2.2-hour national baseline. Maine (4.6), Virginia (4.1), and Vermont (3.9) also post top-five routine-outage figures. For these states, long outage totals are not a one-storm fluke; the everyday numbers are high too. ASCE’s 2025 Infrastructure Report Card notes that 92% of electric service interruptions originate in the local distribution network, the poles and lines in neighborhoods, rather than power plants or transmission (ASCE). New Hampshire is the opposite case: a 1.4-hour baseline, with nearly all of its 12.3 total hours arriving on major event days.
The 10 most reliable states
Ranked by fewest total hours without power in 2024: District of Columbia (0.5), Arizona (1.4), South Dakota (1.4), Massachusetts (1.7), North Dakota (1.7), Rhode Island (1.7), Utah (1.9), Delaware (2.0), Maryland (2.0), and Wyoming (2.3). EIA’s own summary of the year singles out Arizona, South Dakota, North Dakota, and Massachusetts as the states under two hours (EIA, Today in Energy).
What this group shares is visible in the data: none took a direct hit from 2024’s three big hurricanes, and every one of them keeps a tight routine baseline of 1.9 hours or less without major events. DC’s 0.5-hour total is not new, either. In 2022, a mild weather year nationally, DC customers averaged only 34 minutes without power across the entire year (EIA, Today in Energy).
Why outages are getting longer
The trend is not that the grid fails more on ordinary days. Excluding major events, the average U.S. customer has lost roughly 2 hours per year consistently since 2013 (EIA). What changed is the weather on top of that baseline. Total outage duration was about 5.5 hours in 2022, then hit the decade-record 11.0 hours in 2024. Major event days accounted for roughly 9 of those 11 hours, versus a 4-hour major-event average per year across 2014-2023 (EIA). Hurricanes Beryl, Helene, and Milton alone drove 80% of all 2024 outage hours.
The longer arc points the same direction. Climate Central’s analysis of DOE outage filings found that 80% of all major U.S. outages reported from 2000 to 2023, 1,755 events, were weather-related, and that the country logged about twice as many weather-related major outages in 2014-2023 as in 2000-2009. Within the weather category: severe weather such as high winds and thunderstorms caused 58% of events, winter storms 23%, and hurricanes 14% (Climate Central).
Aging hardware makes recovery slower. About 70% of U.S. transmission lines and large power transformers are more than 25 years old (Department of Energy), and ASCE’s 2025 Infrastructure Report Card gave America’s energy infrastructure a D+ with a projected $578 billion investment gap by 2033 (ASCE). 2025 kept the pattern going even without a Helene-scale hurricane: after the March 2025 northern Michigan ice storm, some Montmorency County residents went as long as 18 days without power (WCMU), and the April 29, 2025 windstorm left roughly 800,000 Pittsburgh-area customers dark, some for nearly two weeks (WESA).
What this means for your home
Averages understate your real risk. SAIDI spreads one hurricane across every customer in a state, so a “52.6-hour average” actually means millions of households with near-zero outages and hundreds of thousands who went days without power. When a major event lands on your address, the relevant number is the tail, not the mean: a week for parts of Houston after Beryl, 18 days in the worst of Michigan’s 2025 ice storm. Our breakdown of how long power outages actually last covers what to expect by cause.
Plan against your state’s failure pattern. In hurricane-exposed states like South Carolina, Texas, North Carolina, Florida, and Georgia, prepare for multi-day outages in season; start with the hurricane preparedness checklist. In high-baseline northern states like Maine, Vermont, and West Virginia, shorter outages come more routinely and ice is the recurring threat, so see how to prepare for a winter storm. Either way, know what to do when the power goes out before it does.
Then size your backup power against the worst case in your state’s row, not the average. Use the generator and battery sizing calculator to match capacity to the loads you actually need to keep running, and the runtime calculator to check how many hours your fuel or battery will realistically cover. A setup that covers 2 hours is a very different purchase from one that covers 52.
Methodology
All state figures come from the U.S. Energy Information Administration’s Electric Power Annual 2024, Table 11.4, “SAIDI Values of U.S. Distribution System by State” (eia.gov). SAIDI (System Average Interruption Duration Index) is the standard reliability metric: total minutes of sustained outages experienced by all customers in a year, divided by the number of customers. In plain words, it is how long the average customer’s lights were out over the year. Momentary flickers are excluded; only sustained interruptions count.
EIA reports SAIDI in minutes per customer per year, collected from utilities via Form EIA-861. We converted every value to hours by dividing by 60 and rounding to one decimal (U.S. total: 662.6 minutes = 11.0 hours with major event days; 131.6 minutes = 2.2 hours without). We used the IEEE-standard (IEEE 1366) columns, not the “Any Method” columns, matching the series EIA itself headlines. “Major event days” are the IEEE-defined abnormal days, such as hurricanes and ice storms, so the “without major events” column isolates routine reliability. Data year 2024 is the latest available; this page will be refreshed when EIA publishes 2025 reliability data, expected in fall 2026.
Use this data
Journalists, bloggers, and researchers are welcome to reuse the table, rankings, and any statistic on this page with a link to it. Cite as: Power Outage Planner analysis of EIA data.
Frequently asked questions
Which state had the longest power outages in 2024?
South Carolina, at 52.6 hours without power per average customer, 4.8× the national average of 11.0 hours. Hurricane Helene was the main cause (EIA). Maine (29.1 hours) and Texas (26.9 hours) ranked second and third.
Which state has the most frequent power outages?
Hawaii. Its customers averaged 4.4 interruptions in 2024, roughly triple the national average of 1.5 interruptions per customer (EIA). Frequency and duration rank differently: Hawaii’s total outage time was 6.4 hours, well below South Carolina’s 52.6.
What is the average power outage time per year in the U.S.?
11.0 hours per customer in 2024 including major weather events, the highest in at least a decade. Excluding major events, the average was 2.2 hours, in line with every year since 2013 (EIA).
Why were 2024’s outages so long?
Three hurricanes: Beryl, Helene, and Milton. Major events accounted for 80% of all U.S. outage hours in 2024, roughly 9 of the average customer’s 11 hours (EIA). Routine reliability barely moved.
Which states have the most reliable power?
The District of Columbia led at 0.5 hours of outages in 2024. Among states, Arizona and South Dakota tied for best at 1.4 hours, followed by Massachusetts, North Dakota, and Rhode Island at 1.7 hours each (EIA).
Sources
- EIA, Electric Power Annual 2024, Table 11.4 (SAIDI by state): eia.gov/electricity/annual/html/epa_11_04.html
- EIA, Today in Energy, “Hurricanes in 2024 led to the most hours without power in the United States in 10 years”: eia.gov/todayinenergy/detail.php?id=66744
- EIA, Today in Energy, U.S. reliability trends 2013-2022: eia.gov/todayinenergy/detail.php?id=61303
- Climate Central, “Weather-related Power Outages Rising” (DOE OE-417 analysis, 2000-2023): climatecentral.org
- ASCE, 2025 Infrastructure Report Card, Energy: infrastructurereportcard.org
- U.S. Department of Energy, LPO Tech Talk, Transmission: energy.gov
- Texas Tribune, Hurricane Beryl coverage (July 2024): texastribune.org
- S&P Global, Hurricane Helene outage tally (September 2024): spglobal.com
- Utility Dive, Hurricane Milton outage coverage (October 2024): utilitydive.com
- WCMU, northern Michigan ice storm restoration (April 2025): radio.wcmu.org
- WESA, Pittsburgh storm utility hearing (May 2025): wesanews.org